

In May, the Global Downside Protection (GDP) portfolio’s performance (net of fees) was down 1.73%.
In comparison, the FTSE World capitalization weighted equity index (net of tax) was up 0.24% in the same month.
From the strategy’s inception on June 9, 2015 through the end of May 2016, the GDP portfolio had a loss of 9.66%, net of fees. That is 5.08% below the loss of 4.58% for the global equity index over the same period.

Lightening Up
The GDP strategy went into May with 75% of the portfolio’s exposure in the stock market, which we reduced to 62% after the first week.
On average, there was little net movement in global stocks, but there was a relatively wide dispersion of outcomes. Nine markets gained more than 2% in May, while eight lost more than 7%.
In our view, the poor relative performance of GDP in May was primarily related to unfavorable positioning in several markets:
- The strategy was underweight in the US information technology sector, which was one of the best performers in May at +4.9% for the month. Sector performance was led by Apple (AAPL) which was up 7%, recovering halfway from the 14% drubbing experienced in April on news of declining iPhone sales.
- The portfolio was also overweight to Brazil, which fell 13.8% in May as the recession deepened and additional prominent figures were connected to political corruption.
- Finally, the strategy was overweight to Turkey, which fell 13.7% in May as the Prime Minister resigned, enabling President Recep Tayyip Erdogan to further consolidate his political power.
Performance
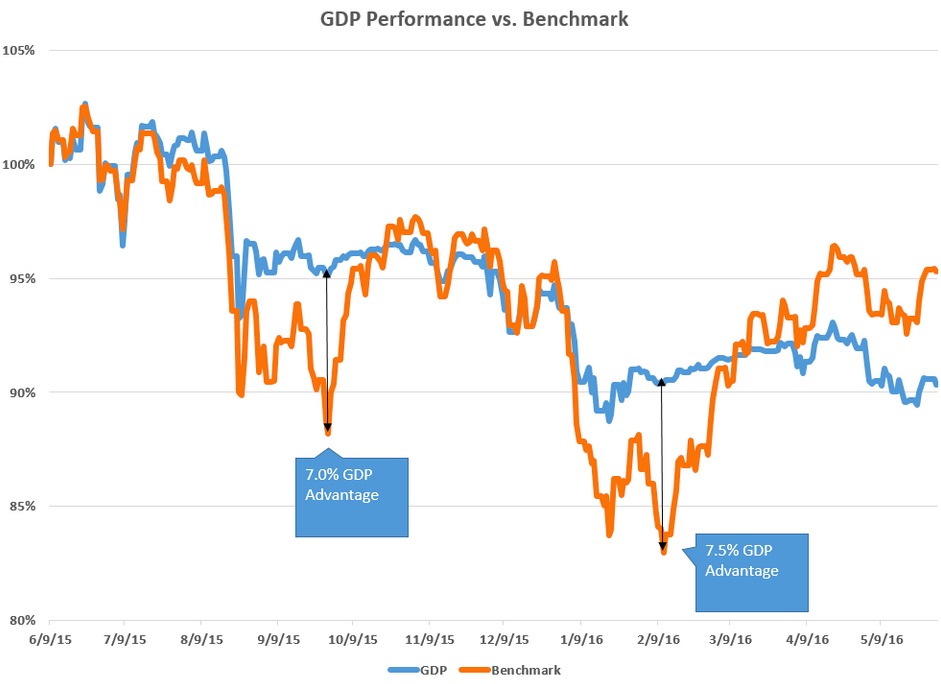
Exhibit A shows the daily performance (net of fees) of GDP since inception, relative to the global equity index.
Volatile Markets
As the chart indicates, the strategy avoided the extremes of the downturns in September 2015 and February 2016.
In each of these months, the advantage of GDP relative to the equity index reached 7% or more, and GDP was successful in protecting against downside risk.
However, the strategy reacts to changes in market direction with a delay–the rapid and large 16% rebound in global stock values from mid-February to mid-April was enough for the equity index performance to overtake the GDP strategy.
As can be seen from the chart, the GDP strategy exhibits far lower volatility than the global equity market. Inception-to-date GDP volatility is two-thirds of the equity index volatility.
Geographic Weight
Exhibit B shows the geographic weights of the GDP strategy by month.
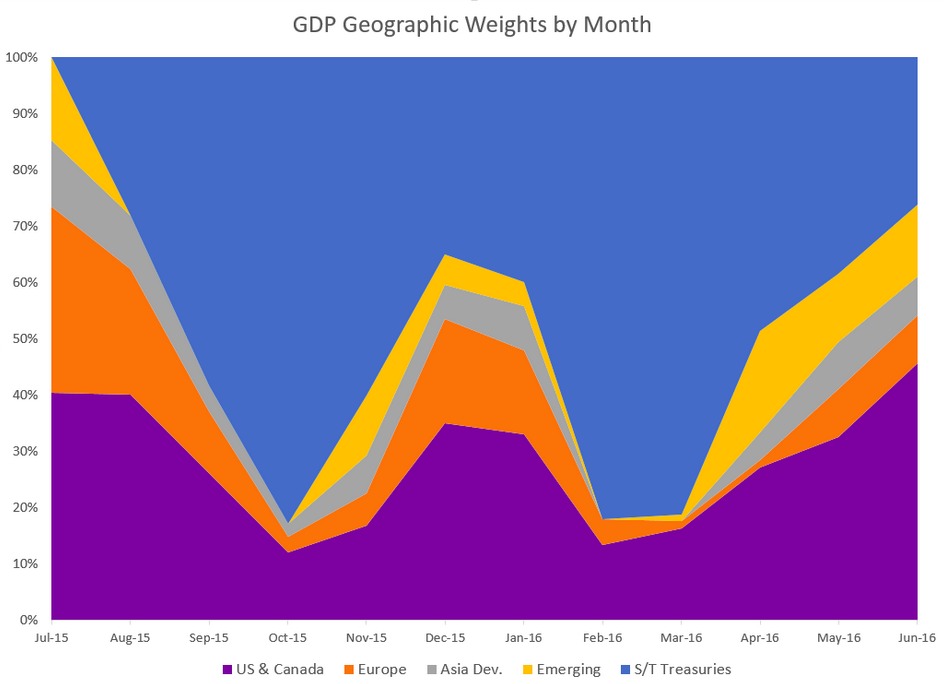
Our momentum metrics for some US sectors became more positive as we added 13.2% to the US weight, spread among energy, financials, materials and mid-cap.
Overall weights in the other geographic regions were little changed. The GDP strategy is now 74% invested in equities as of the end of May, with 26% in short-term fixed income.
The investment principle of GDP is to invest in “good neighborhoods” and avoid “bad neighborhoods.” There is a delay in the decision process as we await confirmation of prior “bad” neighborhoods turning good.
The most challenging periods for the performance of the GDP strategy from a relative performance perspective are when there are large zigzags in price action.
Since we launched the strategy on June 9, 2015, we have already had two rapid and large dips and recoveries in stock prices: August to October 2015 and January to April 2016. It’s rare to have two up and down moves of over 10% in such quick succession.
We continue to be cautious in our outlook. We are in a period of elevated uncertainty regarding the future direction of the world economy and stock prices, with a backdrop of relatively expensive valuations in the most of the developed stock markets, particularly in the US.
The worst time in our view to be an investor in public equities is toward the end of an economic recovery. In the last two recessions, the S&P 500 lost half its value.
As of the end of May, the S&P 500 has recovered back to within 1% of its all-time high, while the global stock index remains 9% below last year’s high. In our opinion, the essential test of this strategy will be in how well it protects our investors in the next major bear market.
Photo Credit: Frank via Flickr Creative Commons


