

Is the historic bull market that began in March of 2009 on life support?
Nobody knows for sure of course when, or if, the rally will run out of steam in 2016. However, there are reasons for concern.

Steep Declines
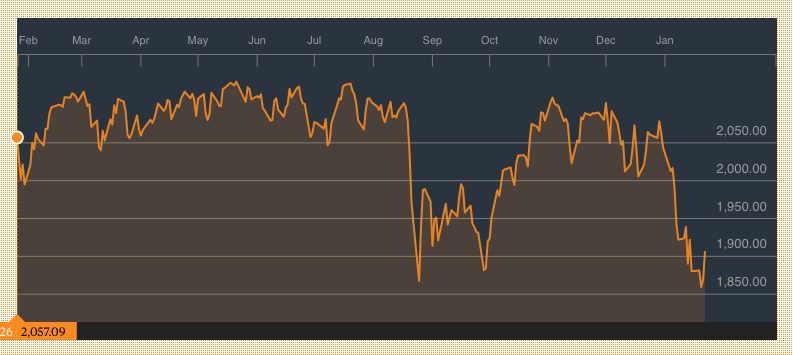
The Dow Jones Industrial Average and S&P 500 are down 12% and 11%, respectively, from their highs as of January 22.
A bear market is defined as a market decline of 20% or more from a previous peak.
We are more than halfway there.
50-Day Averages
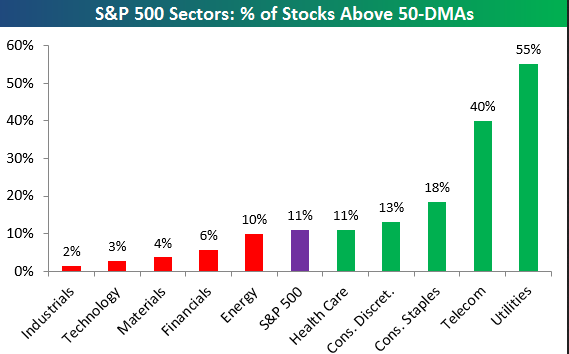
The breadth of the rally is now pretty weak, judging by the percentage of stocks trading above their 50-day moving average, according to Bespoke Investment Group.
Overall, only 11% of stocks traded on the S&P 500 are trading above that mark.
Individual sectors such as industrials (2%), technology (3%) and financial (6%) are even in worse shape by this measure.
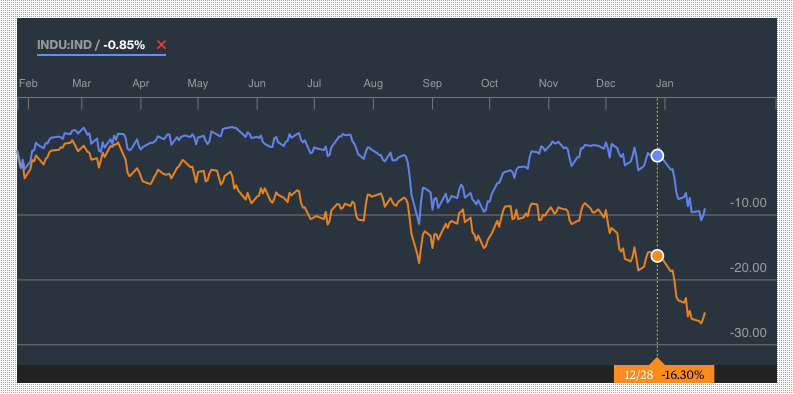
Transportation Weakness
And as the Wall Street Journal has pointed out, the bellwether transportation sector has been doing worse than broader market indexes.
Historically, that’s a sign that the bear is at the door.
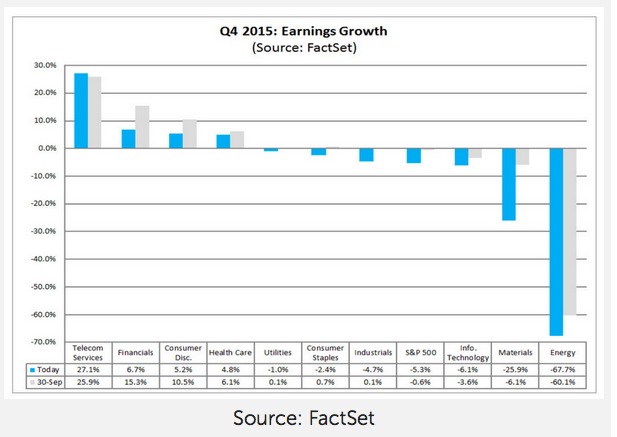
Earnings Fizzle
Price-to-earnings ratios, a measure of how expensive stocks are, have come down.
Yet that’s cold comfort since earnings have tumbled as well.
Financial data firm FactSet predicts S&P 500 companies will report an average 5%-plus decline when they finish reporting fourth quarter results.
Takeaway
The foundation of the six-year plus stock rally is starting to crumble.
Unless earnings start to improve, it is hard to see what powers the stock market going forward.
Photo Credit: Zooey via Flickr Creative Commons


