If you’ve been hanging in there with your stock investments, you’ve done just fine so far in 2015.
The same can’t be said other asset classes.
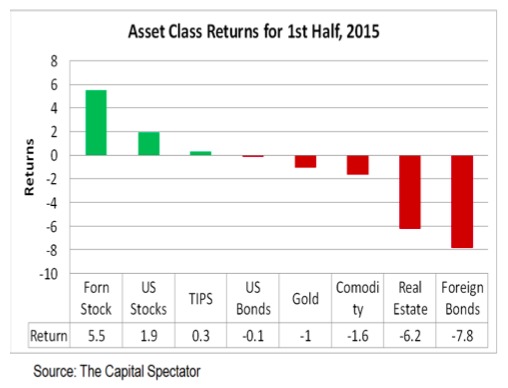
For example, the Russell 3000 has returned 1.9% in the first half of 2015 and EAFE has earned 5.5%.
Every other asset class has performed poorly over the past 6 months, according to The Capital Spectator.

Small-Caps Shine
The S&P 500 lagged the total U.S. stock market, and EAFE lagged the total foreign market, primarily because smaller companies have performed best.
Equity Exposure
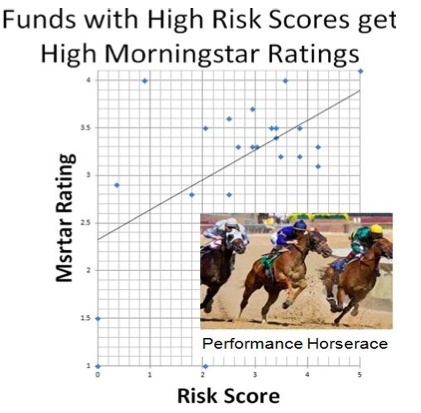
The dominance of stocks over the past 5 years has given target date funds with high equity exposure a performance edge and high Morningstar ratings.
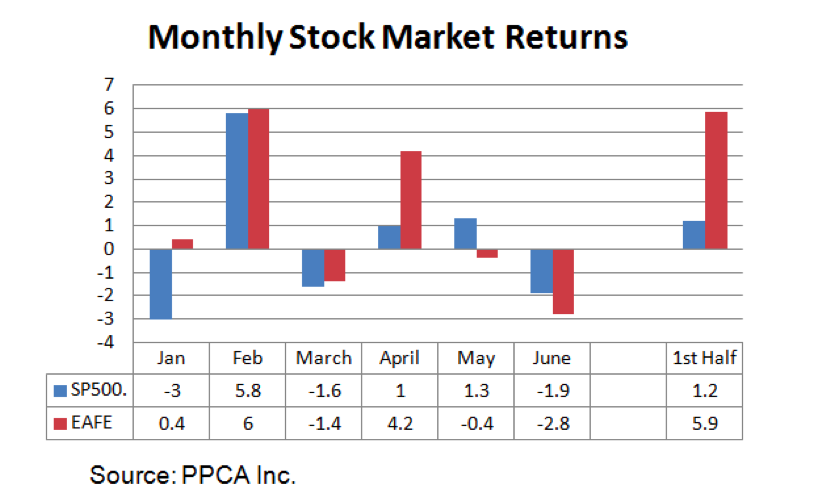
All of the US performance in the first half occurred in February, while foreign markets enjoyed a pop in both February and April.
Monthly US and foreign stock market returns are shown in the next graphic.
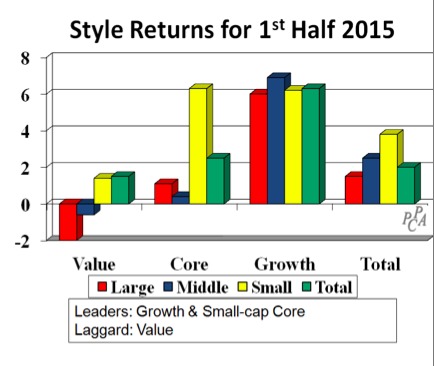
U.S. Stocks
Small companies, except small cap value, have led in the half, returning 6%, while value companies have lost 2%.
Most of the return has come from just two sectors: health-care and consumer discretionary.
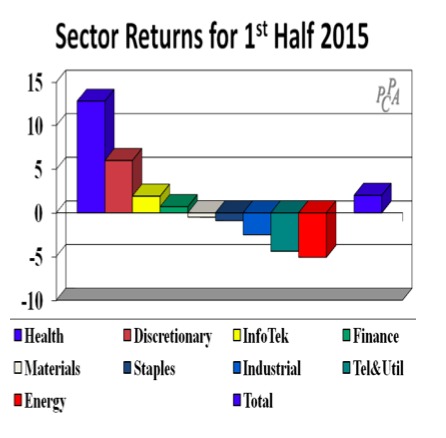
Sector Analysis
Health-care stocks have earned 13%, followed by consumer discretionary with a 6% return.
All other sectors are near or below zero, with energy stocks suffering the worst loss, at -5%.
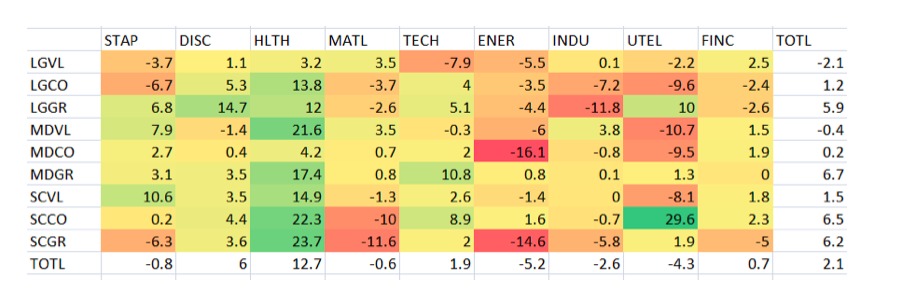
Drilling deeper into US market segments, the following heat map shows performance within style-sector cross-sections, where we see that small-cap core utility stocks have performed best with a 29.6% return, while mid-cap core energy stocks have lost the most, with a 16.1% loss.
That’s a 45% spread!
Foreign Stocks
Looking outside the US, foreign markets earned 8% in dollar terms, exceeding the U.S. stock market’s 1.9% return and EAFE’s 6% gain.
Like the US, smaller companies have performed best, earning 15% versus 10% for the rest of the market.
Also like the US, growth stocks have led with a 15% return, while the rest of the market has earned 6%.
The following heat maps show sector-style-country cross-sections, providing more details.
As you can see, small cap growth stocks in Asia ex-Japan have earned 52.6%, in contrast to 14.3% losses in Canadian industrials – a 67% spread.
Outlook
Stock markets have continued their growth this year, while other asset classes have struggled.
Will these continue?
We all have outlooks on the economy and the stock market, and adjust our thinking as results roll in.
I personally remain surprised and grateful that stocks have performed so well in the past 5 years, following the 2008-2009 meltdown.
Photo credit: Sam Valadi via Flickr Creative Commons