Volatility raised its ugly head yet again, as the world wonders just when the Fed will let its foot off the accelerator and start to wind down their Quantitative Easing strategies. The dominoes started to fall every time someone suggested the winding down or “tapering” would begin. Was it this summer, this Fall , or maybe Winter of 14 ?
The new market word of the month is now clearly “taper” , knocking out the previous champion “Risk On – Risk Off”, which we kind of liked as the phrase has Exotic Asian flair. Think Miyagi in the Karate Kid, “Wax on, Wax Off,” and breathe deeply, don’t forget to breathe.
Anyway, I thought we should take a look at one of the major market charts we follow. Let’s first review the famous monthly employment, or unemployment, numbers.
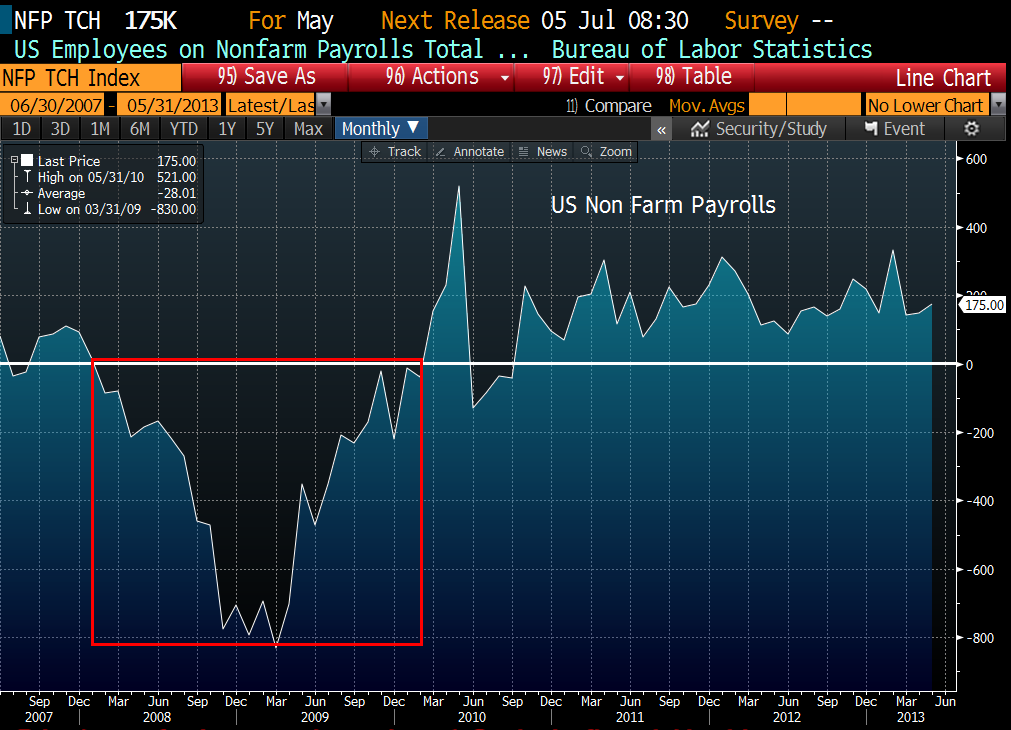
The Red Box is the number of jobs lost during the financial crisis, the white line being zero job growth. The economy lost a minimum 200,000 jobs per month from July of 2008 until September of 2009; we had a six month period where we averaged over 700 jobs lost per month.
We still have some major catch-up work to do after this devastating period, even with the current recovery we still have of 3,600,000 jobs left to create to get back to 2007 levels. Even calling the current average pace of job creation 200,000 per month, we are looking at another 18 months to get back to square one.
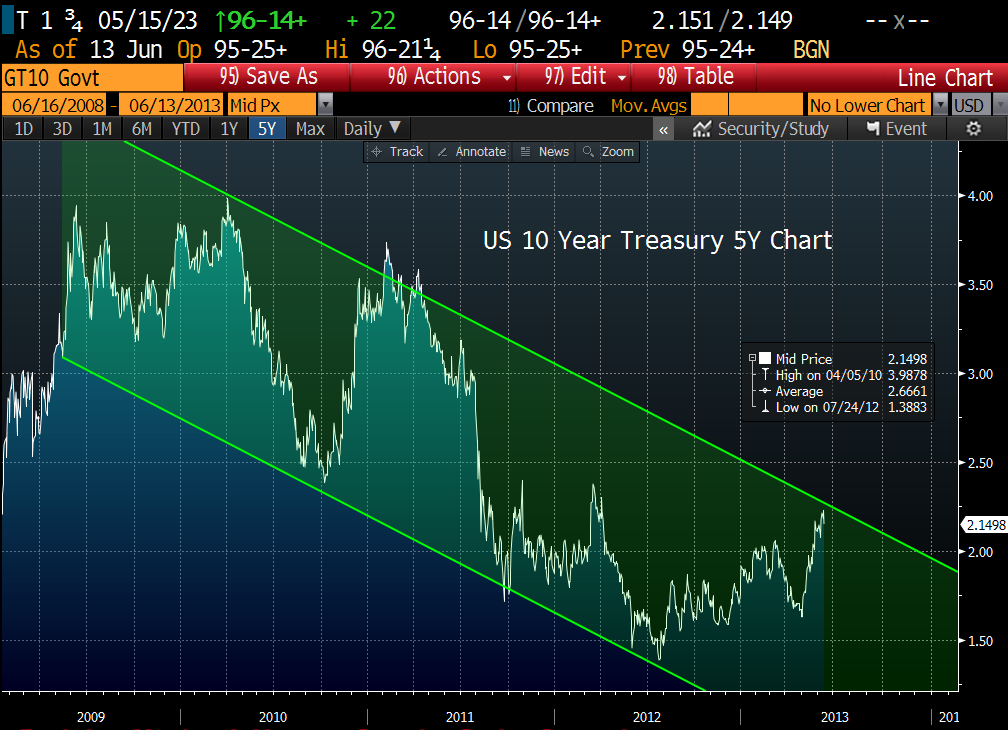
This is a chart of the US Government 10 year bond’s yield to maturity; note that yield and prices move inversely, so good is bad and vice versa. Also note yields are rising as bond prices are dropping; some say this is clearly the end of the 30 year bond bull market.
Looking at the five year trend channel (marking the markets highs and lows) and you see we have tried to break out of this channel a few times before. Will it happen this time? It seems logical, certainly. Bull markets cannot go on forever, but more than a few people were surprised the last few times we thought that this bull was dead…ah but it’s different now…or is it?
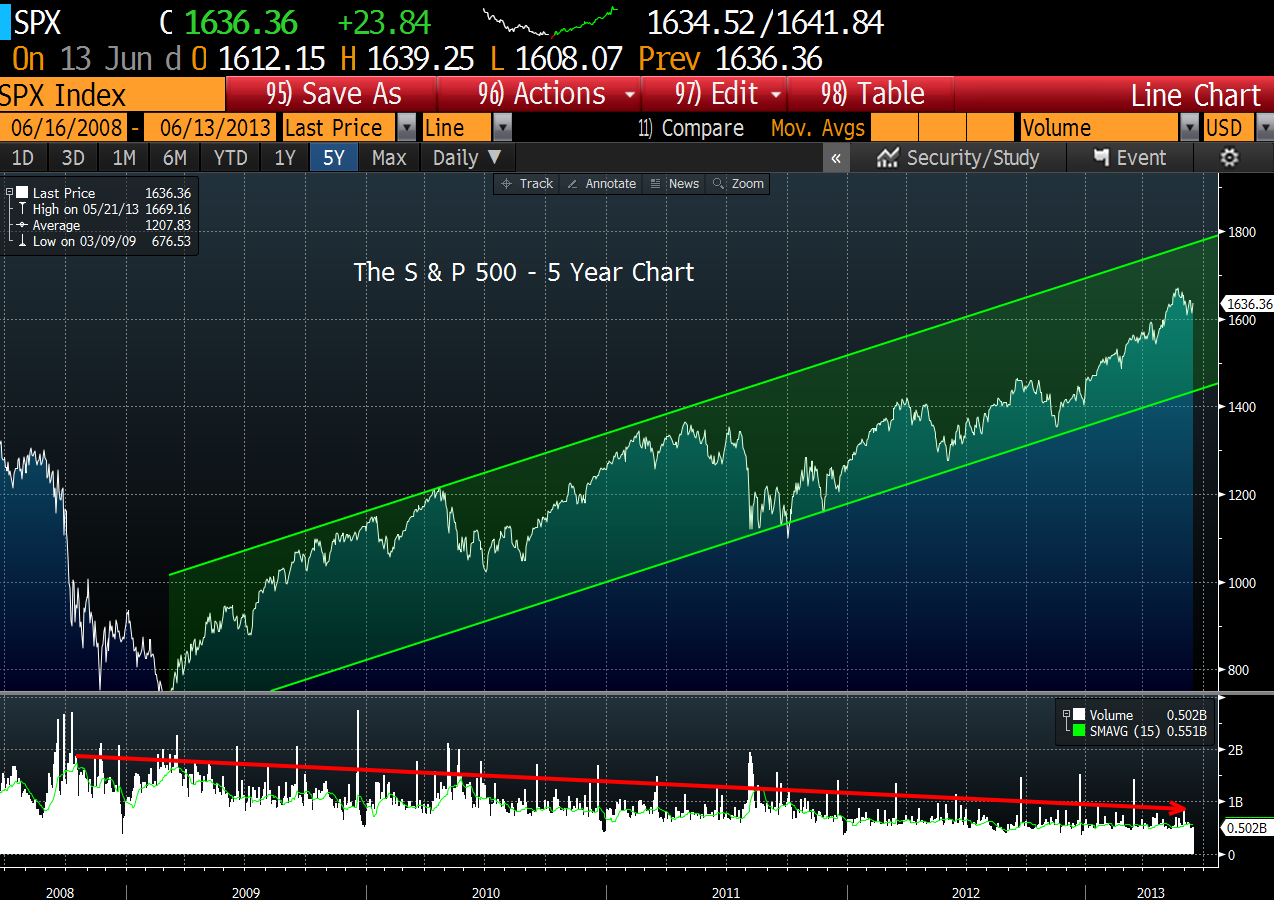
The S&P 500 Index seems to be firmly planted in its current five year trend channel, with no real reason to suspect it should change anytime soon, in our opinion, save trying to predict the end of quantitative easing.
The end of QE would obviously stop the flow of newly printed cash from finding its way into the equity markets. Is the declining volume depicted on the bottom of this graph starting to tell a story of an aging equity bull market?
Currently there just doesn’t seem to be any reason, based upon the longer term trends, to feel things will change much soon in our opinion, but predicting the whims and corresponding market direction changes is a very difficult game to get right consistently.
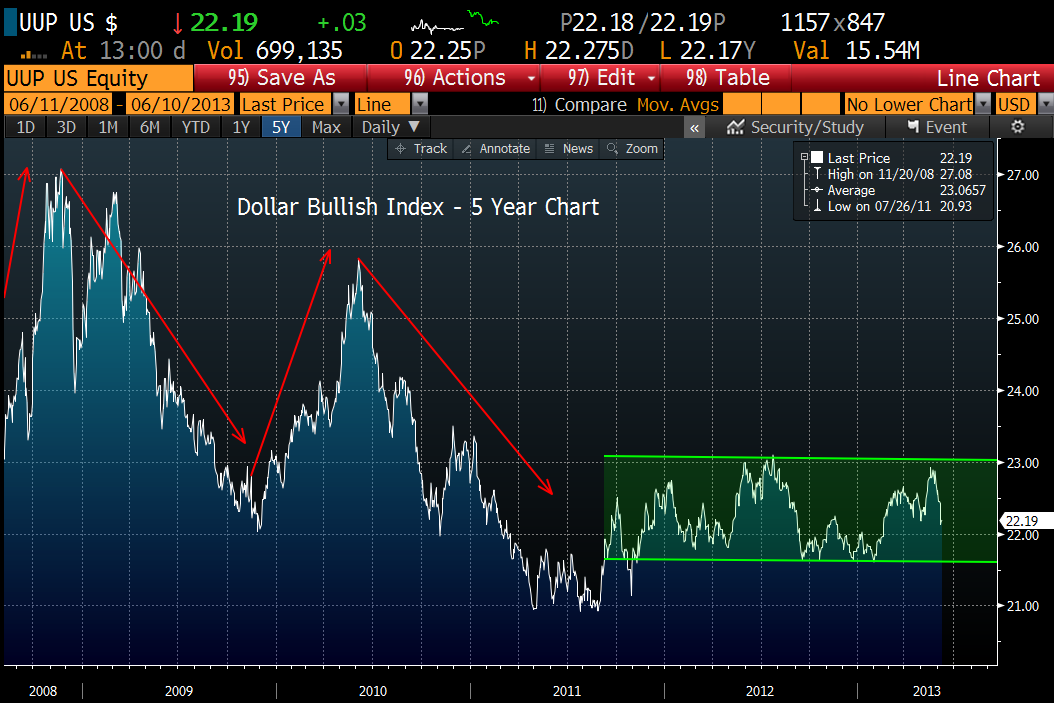
The PowerShares DB US Dollar Index Bullish Fund (UUP) is an exchange-traded fund (ETF) designed to replicate being long the US Dollar against the following currencies: Euro, Japanese Yen, British Pound, Canadian Dollar, Swedish Krona and Swiss Franc.
After some extreme volatility, we have settled into a range now which we seem to be in the middle of, this index has typically moved inversely to the general equity markets, as investors buy dollars to purchase US Treasuries during any crisis.
This ETF doesn’t carry the direct interest rate exposure of US bonds, but once the storm or a crisis blows over, and interest rates rise as bond prices fall, we believe it should still be insulated to a degree. All else being equal higher US interest rates typically mean stronger currencies, as global investors seek to maximize their returns.
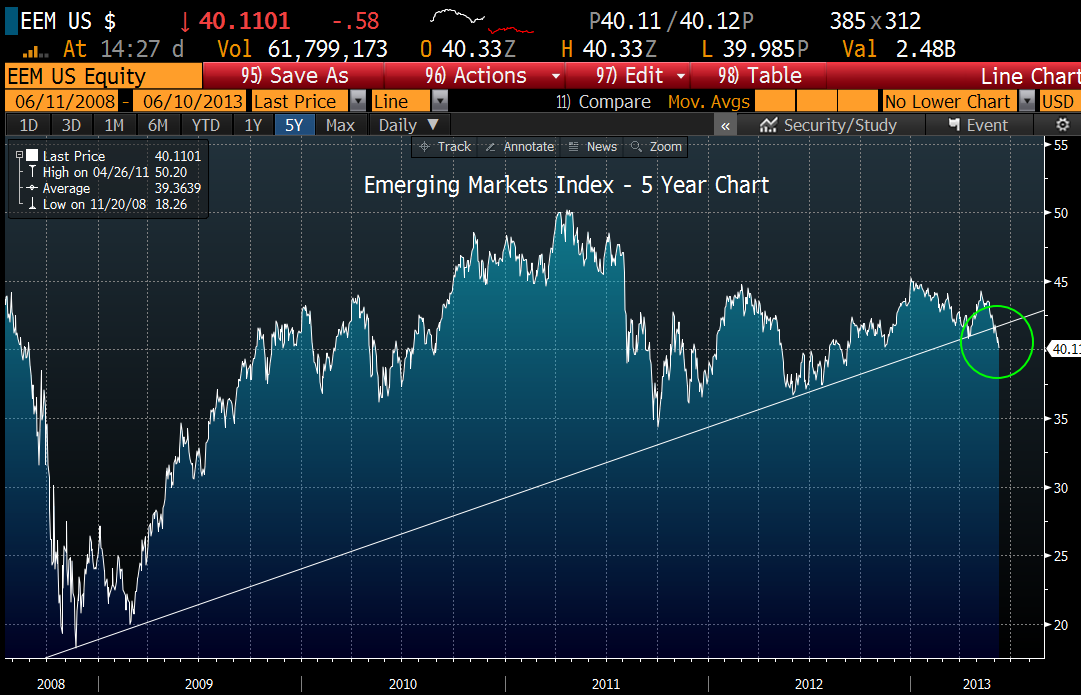
Emerging market equity indexes have now broken down through some of their longer term trend lines and so do appear to be weakening, but we know this asset class has long been one the most volatile around.
In our experience, they often provide powerful returns adding value to any portfolio, but can we reliably predict just when they will be hot and when they are not…we don’t think so. We believe it’s best to just own a slice of this asset class, try to keep it a steady percentage of assets , and just move along.
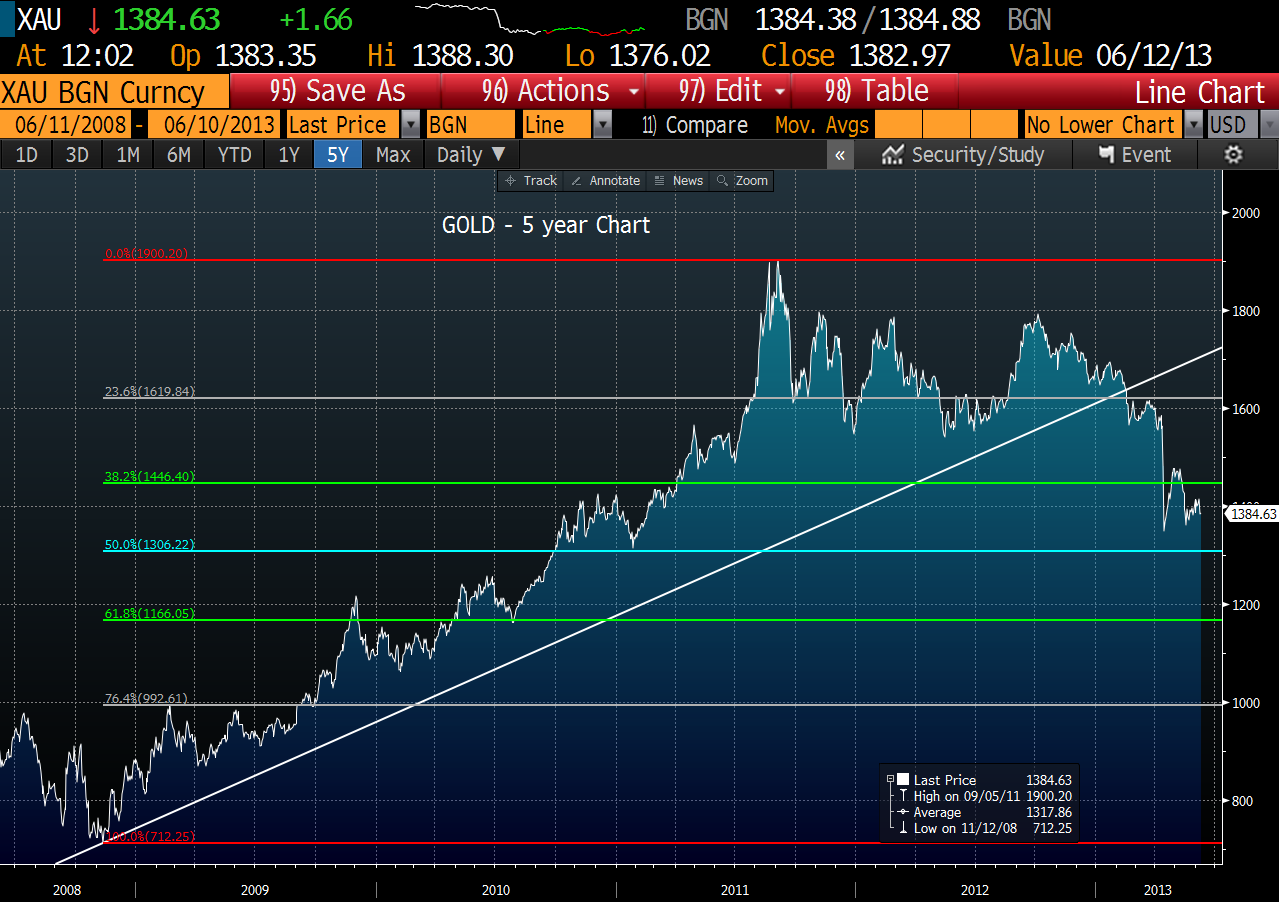
And finally gold wins again as the most hated asset class of the month. Looking at the above graph with the Fibonacci retracements numbers overlaid, it would seem that market technicians would say gold could easily pull back to 1300 or so before it “retraced” 50% of the 5-year move to 1900 from the low of 700 in November of 2008.
We do know that gold has often provided insulation for our portfolios when things have gotten crazy in the markets, but sometimes we must endure a bit of margin clerk or forced liquidations first. The gold market is deep, and since margin calls must be met, often the most liquid asset is sold first, without regard to what the actual owner might think.
When protecting your job or your company by covering an unmet margin call, the easiest, most liquid assets are first out the door. There is no time for conversation, just fix the problem (unmet margin calls). So, when they raid the brothel, even the good girls and the piano player goes to jail.
Not so long ago, in the summer of 2011, when Europe was exploding, gold gave our portfolios good insulation, ah but market memories are short. Do we or can we know what happens next, obviously not, but given we have had significant
“Black Swan” type events just about every three years, we still feel it’s smart to have a significant allocation to Gold to help potentially insure against another such catastrophe.
It of course doesn’t look so grand at this point, but the purpose of our portfolios is long term success, turning off the daily noise, and knowing that we aren’t overloaded with just equity exposure.
It is impossible to know the unknowable; so all the rest is just guesswork. Not always a good thing. When will the fed “taper” down their $85 billion dollars a month asset purchasing known as quantitative easing (QE)? Well, just spin the dial and place your bets…ah, but maybe not. We still believe the best stance, is to be involved in multiple asset classes, not all will be up nor down in any given day.
Going forward perhaps we tinker here and there with the exact percentages and relationships of certain assets, but we also believe that over the long term an exposure to a broad group of assets should hopefully provide us with a better overall returns.
The investments discussed are held in client accounts as of June 30, 2013. These investments may or may not be currently held in client accounts. Investors cannot invest directly in an index. Indexes have no fees. The reader should not assume that any investments identified were or will be profitable or that any investment recommendations or investment decisions we make in the future will be profitable.