

By Michael Tarsala, CMT
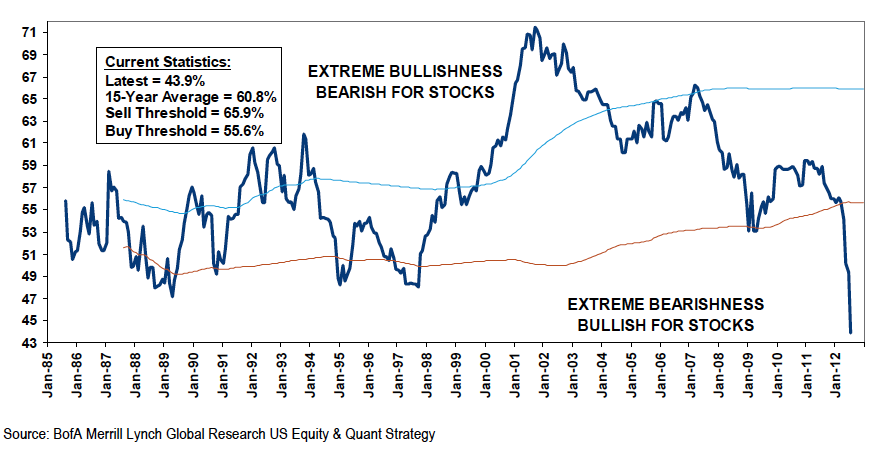
Sell-side stock strategists are more bearish on stocks than at any point in the past 27 years, according to the latest from the quant research group at Merrill Lynch.
Strategists are now recommending a portfolio weighting in stocks of less than 45% – a lower percentage than at any time during the collapse of the tech market, or the 2008 financial crisis.

Source: Ritholtz.com
The BofA Merrill indicator is supposed to be contrary in nature. Extreme bullishness on the part of the strategists is usually a sell signal, and extreme bearishness a buy signal.
According to the research, strategists have recommended a 60.8 % bullish weighting, on average, over the past 15 years. The moving “buy” threshold for the index right ow is when it dips below 55.6%. The “sell” threshold is when it rises above 65.9%.
So right now, the lowest-ever reading recommended weighting of 43.9% is considered a “buy”.
It’s hard to pinpoint precisely when to buy, though. Do you buy when the index first crosses the “buy” line, or when it crosses back above it? Or do you simply begin to accumulate stocks during periods when it’s trading below the line?
One possible strategy is to combine BofA Merrill’s sentiment work with other market indicators.
Perhaps the simplest would be to begin looking for a positive 50-over 200 simple moving average cross when sentiment reaches the very low buy threshold, or in the months thereafter.
Here’s what holding for two years following such a “buy” signal would return, not adjusted for trading costs:

Source: Yahoo Finance
That’s not to say that investors should follow this particular strategy. There are likely far better ones that incorporate sentiment into the mix.
Rather, I think it speaks to the usefulness of contrary sentiment for long-term investors, and how it can be viewed in the big picture.
Buying when others are fearful and selling when they are greedy not only makes sense, it can work.


